.svg)
.svg)
.svg)
.svg)

.svg)

.svg)


Norfolk Southern Corporation's Bullish Outlook: A Technical and Fundamental Analysis
Understanding the Potential Breakout for NSC Shares
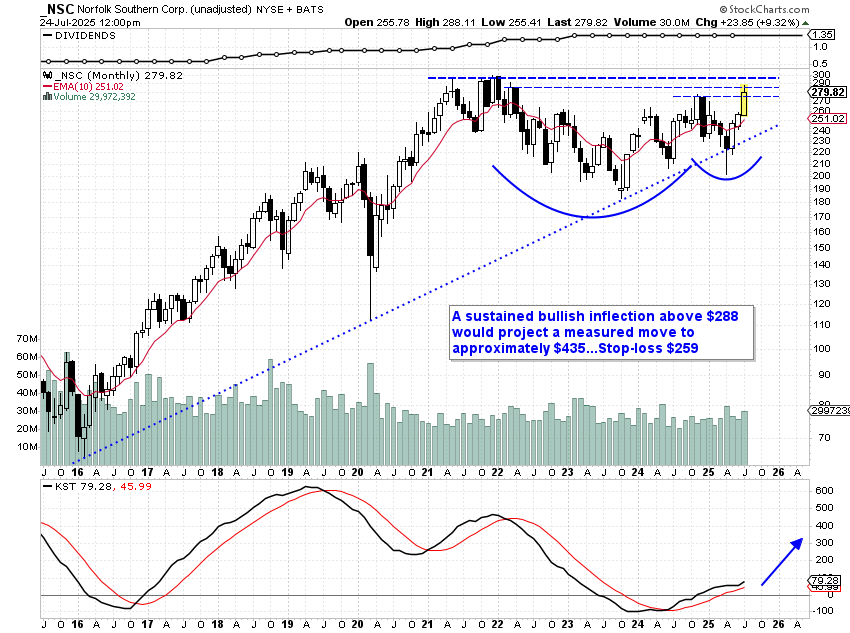
Norfolk Southern Corporation (NSC), a prominent player in the rail transportation sector, is currently under the spotlight for its potential bullish breakout. A classic Cup & Handle pattern has emerged, suggesting a significant price movement. A breakout above $288 is anticipated to project the stock to approximately $435, offering investors an attractive risk-reward ratio of 7:1. This analysis delves into the technical setup, company fundamentals, recent financial performance, and strategic insights to empower investors with a comprehensive understanding of NSC's current market position.
Key Insights:
NSC is poised for a technical breakout with a target price of $435, contingent on clearing the $288 level.
The company maintains solid financial health, with a revenue of $300.7 billion and consistent dividend payouts.
Recent merger discussions with Union Pacific may act as a catalyst for future growth.
A stop-loss at $259 is recommended to limit downside risk and ensure a favorable risk-reward scenario.
Technical Setup: The Cup & Handle Pattern
The Cup & Handle pattern is a classic technical formation indicating a potential bullish breakout. For NSC, this multi-year pattern suggests a robust upward movement upon breaking the $288 threshold.
Pattern Overview: The Cup & Handle is characterized by a rounded bottom (the cup) followed by a consolidation period (the handle) before a breakout.
Entry Point: A sustained move above $288 indicates a confirmed breakout.
Target Price: The measured move suggests a target of $435.
Stop-Loss Strategy: Implementing a stop-loss at $259 minimizes potential losses to 7.8% of capital deployed.
Entry (Breakout) | Target | Stop-Loss | Risk/Reward |
|---|---|---|---|
$288+ | $435 | $259 | ~7:1 |
Company Profile: Norfolk Southern Corp.
Norfolk Southern is a leading rail transport service provider, offering freight services for various industries across the eastern United States. The company's extensive network and strategic partnerships position it as a key player in the transportation sector.
Revenue: $300.7 billion
Net Income: $66.5 billion
EPS (Diluted): $238.17
Dividend Yield: Consistent quarterly payout of $1.35 per share
Total Assets: $2,480.4 billion
Long-term Debt: $330.6 billion
Recent Financial Performance
Norfolk Southern's recent financial results highlight its strong operational capabilities and financial health.
Q2 2024 Highlights: Achieved a net income of $1.1 billion, supported by robust operating cash flows amounting to $90.4 billion.
Dividend Consistency: The company continues to maintain a steady dividend payout, reinforcing investor confidence.
Balance Sheet Strength: With significant assets and manageable debt, NSC is well-positioned to capitalize on growth opportunities.
Ex-Date | Pay Date | Amount |
|---|---|---|
2024-05-02 | 2024-05-20 | $1.35 |
2024-02-01 | 2024-02-20 | $1.35 |
2023-11-02 | 2023-11-20 | $1.35 |
Market Sentiment and Analyst Forecasts
Consensus Price Target: Analysts project a price range of $275–$280, with potential for higher gains if the technical breakout materializes.
Street Ratings: Predominantly "Buy" or "Outperform," reflecting confidence in NSC's growth trajectory.
Earnings Outlook: For Q2, the expected EPS is approximately $3.26, indicating continued operational strength.
Strategic Insights and Catalysts
Technical Breakout Potential: A confirmed breakout above $288 can trigger momentum buying and attract diverse investor interest.
Merger Discussions: Ongoing talks with Union Pacific could serve as a significant growth catalyst, enhancing network capabilities and market reach.
Risk Management: Implementing a stop-loss at $259 provides a safety net against adverse market movements.
Conclusion
Norfolk Southern Corporation presents a compelling investment opportunity driven by a favorable technical setup and solid fundamental performance. The potential breakout from the Cup & Handle pattern, combined with strategic initiatives and robust financial health, positions NSC as a strong contender for investors seeking growth with manageable risk. As the stock approaches the critical $288 level, investors should monitor volume and market sentiment to confirm the breakout and capitalize on the anticipated upward trajectory.
For further insights and detailed analysis, visit DeepStreet.io, your trusted source for financial analytics and market intelligence.