.svg)
.svg)
.svg)
.svg)

.svg)

.svg)


Lululemon Athletica's Stock Takes a Bearish Turn: Implications and Strategies
Understanding Lululemon's Technical Breakdown and What It Means for Investors
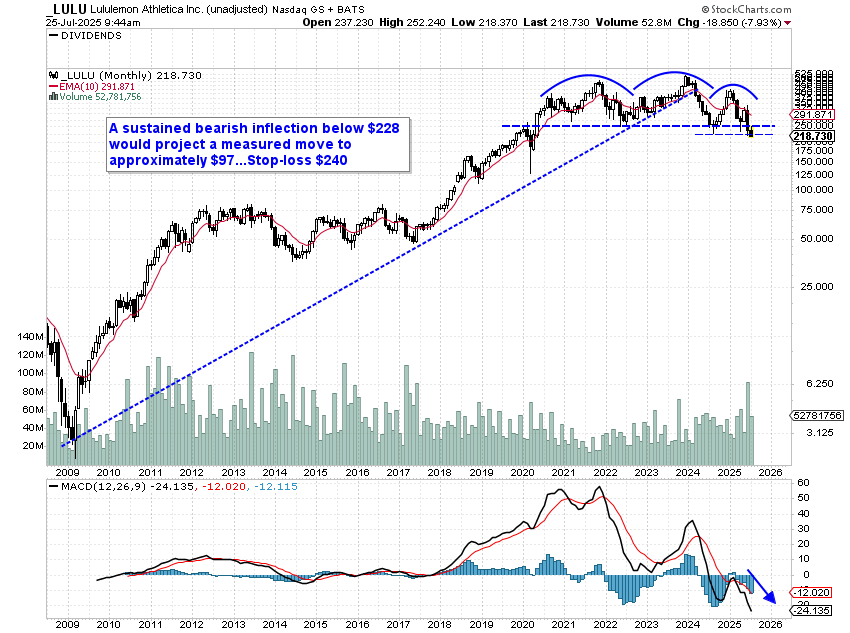
Recent market movements have placed Lululemon Athletica (LULU) under the spotlight, particularly due to a significant technical development that suggests potential downside risks. The shares have breached a critical neckline in a multi-year "Head & Shoulders" chart pattern, a classic bearish indicator. This article delves into the implications of this pattern, Lululemon's financial health, and what investors might consider in light of these developments.
Key Insights:
Lululemon's stock has dropped below a critical support level, signaling a potential bearish move.
The company remains fundamentally strong, with robust revenues and a strategic growth plan.
Analysts provide mixed forecasts, reflecting divergence between technical and fundamental perspectives.
The current risk/reward setup offers opportunities for tactical traders.
Technical Analysis: A Bearish Signal
The "Head & Shoulders" Pattern
The "Head & Shoulders" pattern is often viewed as a reliable reversal indicator, suggesting a shift from bullish to bearish sentiment. Lululemon's breach below the $228 neckline represents a significant technical event. If this breakdown is sustained, the pattern's measured move projects a potential target near $97.
Parameter | Value |
|---|---|
Breakdown Level | $228 |
Bearish Target | $97 |
Stop-Loss | $240 |
Risk/Reward Ratio | 5:1 |
Implications of the Breakdown
Potential Downside: The breach suggests a bearish outlook, with a substantial downside target.
Risk Management: Setting a stop-loss at $240 helps manage risk, limiting potential losses to approximately 9.6%.
Trading Strategy: The attractive 5:1 risk/reward ratio makes this setup compelling for traders who can manage volatility and adhere to their risk parameters.
Lululemon Athletica: Financial Strength and Strategic Focus
Company Overview
Lululemon Athletica is a leading player in the athletic apparel industry, known for its technical gear and innovative designs. The company has a robust business model, evidenced by its financial performance and strategic initiatives.
Metric | Value |
|---|---|
Revenue | $121.8 billion |
Net Income | $17.97 billion |
Gross Profit | $68.43 billion |
Operating Income | $25.55 billion |
Cash from Operations | $22.99 billion |
Total Assets | $220.25 billion |
Equity | $141.07 billion |
Recent Performance and Strategic Initiatives
Revenue Growth: Lululemon achieved a 7% increase in revenue to $2.4 billion in the first quarter of fiscal 2025, reflecting strong performance across channels and markets.
Cash Position: The company maintains a healthy cash reserve of $1.3 billion, supporting its strategic growth initiatives.
Inventory Management: Inventories increased by 23%, signaling potential future sales growth.
"In the first quarter, we achieved growth across channels, categories, and markets, including the U.S., reflecting the continued strength and agility of our business model." — Calvin McDonald, CEO
Analyst Forecasts and Market Sentiment
Divergent Views
Analysts provide mixed signals regarding Lululemon's future price targets, reflecting the tension between technical analysis and fundamental strength.
Source | 2025 Price Target Range | Analyst Consensus |
|---|---|---|
CoinCodex | $263 - $378 | Mixed |
TradingView | $334.52 (avg), up to $500 | Bullish |
TipRanks | $2.54B next quarter sales | Neutral |
Market Sentiment
Recent news highlights challenges such as weak U.S. demand and rising costs, which could impact Lululemon's margins and growth outlook. However, the company's innovation pipeline and international expansion remain key growth drivers.
Practical Applications: Navigating the Current Market
For Bearish Traders
Strategy: Consider shorting LULU if the breakdown holds, targeting a move toward $97.
Risk Management: Implement a stop-loss at $240 to cap potential losses.
For Long-Term Investors
Focus on Fundamentals: Despite technical challenges, Lululemon's strong financials and strategic initiatives offer long-term growth potential.
Monitor Developments: Keep an eye on the company's innovation pipeline and international growth to gauge future performance.
For Market Watchers
Volatility Awareness: Expect increased volatility as technical and fundamental narratives play out.
Divergent Trends: Be prepared for potential sharp moves, either downwards or a quick recovery, based on market sentiment and company announcements.
Looking Ahead
Lululemon Athletica stands at a critical juncture, with its stock reflecting significant technical and fundamental dichotomies. While the "Head & Shoulders" pattern suggests a bearish outlook, the company's robust financials and strategic initiatives offer a counter-narrative. Investors and traders alike should remain vigilant, balancing technical signals with fundamental insights to navigate this complex market landscape. For further insights, continue exploring DeepStreet.io for the latest market analyses and strategies.