.svg)
.svg)
.svg)
.svg)

.svg)

.svg)


FactSet's Bearish Technical Outlook: Navigating the Inverted "Saucer" Pattern
A closer look at the technical signals and strategic implications for FactSet Research Systems as the stock breaks key support levels.
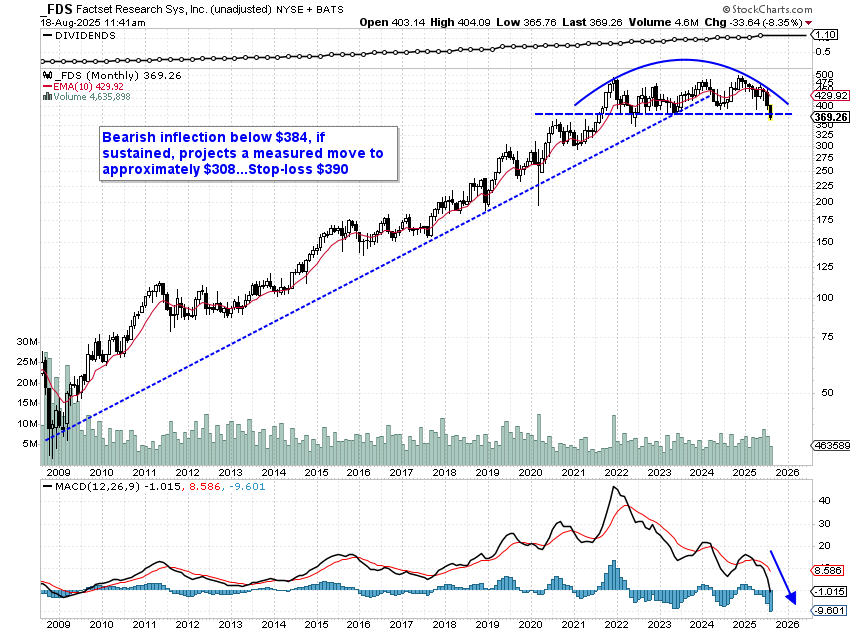
In the ever-evolving landscape of financial markets, technical analysis offers a lens through which investors can anticipate price movements and make informed decisions. FactSet Research Systems Inc. (FDS), a prominent player in the financial data and analytics industry, is currently under the microscope of technical analysts due to a significant pattern formation on its charts. The stock has breached a critical support level at $384, signaling potential challenges ahead if the bearish pattern holds.
Key Takeaways:
FactSet's stock has broken below a crucial support level, marking a potential bearish trend with a target decline to $308.
A stop-loss at $390 is recommended to manage downside risk, providing a favorable risk-reward ratio.
Despite the technical bearish outlook, FactSet's strong financials and consistent dividend growth offer a solid foundation for long-term investors.
Understanding the Inverted "Saucer" Pattern
Analyzing the Technical Breakdown
The inverted "Saucer" or rounded top formation is a rare but potent technical indicator suggesting a reversal from an uptrend to a downtrend. This pattern's completion at the $384 neckline marks a critical juncture for FactSet's stock.
Pattern: Multi-year inverted "Saucer" (rounded top), a bearish reversal formation.
Trigger: Price fell below the neckline at $384.
Projection: If the breakdown is sustained, the measured move targets approximately $308.
Risk Management:
Stop-loss: $390 (limits downside to about 5.6%).
Risk/Reward: Attractive 3:1 ratio if the trade thesis plays out.
Summary Table
Level | Price | Role |
|---|---|---|
Stop-loss | $390 | Risk limit |
Neckline | $384 | Bearish trigger |
Target | $308 | Measured move |
Indicator Analysis
Technical indicators further reinforce the bearish sentiment surrounding FactSet's stock:
RSI and MACD:
No recent RSI overbought signals, with 10 oversold instances indicating bearish momentum.
10 MACD bearish crossovers confirm a continuing downside bias.
SMA/EMA Trends:
Both the SMA and EMA are above the current price, supporting the downtrend's continuation.
FactSet's Business Resilience
Company Overview and Strengths
Despite the technical challenges, FactSet remains a robust enterprise with a solid reputation in the financial data sector.
Business Model: Provides financial data, analytics, and software to investment professionals.
Strengths:
Recurring revenue model ensures steady cash flows.
Long history of dividend increases, enhancing its appeal as a reliable income stock.
Recent Developments:
Regular dividend declared at $1.10/share as of August 2025.
Positive coverage as a dependable dividend grower from sources like Kiplinger and Seeking Alpha.
Financial Health and Performance
Recent Financial Results
FactSet's Q3 2025 financials highlight its operational strength, despite the stock's technical pressures.
Revenue: $41.35 billion
Net Income: $9.78 billion
Operating Cash Flow: $12.5 billion
EPS (Diluted): $244.64
Balance Sheet Strength:
Assets: $136.8 billion
Equity: $65.0 billion
Debt: $44.2 billion, manageable given robust cash flows.
Dividends: Consistently rising, with the latest quarterly payment at $1.10/share.
Strategic Insights for Investors
Navigating the Current Market Dynamics
Investors face a nuanced landscape with FactSet, balancing technical signals against strong fundamentals.
Technical Risk: Continuation below $384 could lead to further selling pressure toward the $308 target.
Fundamental Backdrop: A strong financial position and dependable dividends make FactSet attractive for long-term holding, despite the technical challenges.
Investor Decision Points:
Short-term traders: May capitalize on the downside potential with tight stop-loss orders.
Long-term holders: Could view price dips as buying opportunities, given the company's underlying strength and stable dividend history.
Looking Ahead
While FactSet's stock charts currently paint a bearish picture, the company's financial resilience and strategic positioning in the financial services sector offer a counterbalance. Investors should weigh technical insights alongside fundamental analysis to align with their investment objectives and risk tolerance.
Explore more insights and strategic analyses at DeepStreet.io to stay ahead in the dynamic world of financial markets.