.svg)
.svg)
.svg)
.svg)

.svg)

.svg)


DIA's Technical Breakthrough: A Bullish Signal for the Dow
Analyzing the Implications of DIA's Move Above the Transition Zone
The SPDR Dow Jones Industrial Average ETF Trust (DIA) has recently moved above a key technical level known as the "Transition Zone," signaling a bullish trend and triggering new trades for many systematic trend-followers. This move is significant for investors looking to capitalize on momentum shifts within the market, providing potential opportunities to ride an emerging uptrend.
Key Takeaways:
Bullish Crossover: DIA has crossed above the "yellow channel Transition Zone," suggesting a shift from neutral to bullish market sentiment.
Momentum Confirmation: This move indicates that buyers have gained control, potentially leading to further upside.
Systematic Trading Signal: The crossover triggers a new long position under trend-following strategies, emphasizing disciplined entry and exit points.
Risk Management: With volatility considered, systematic traders set stop-losses to manage risk effectively.
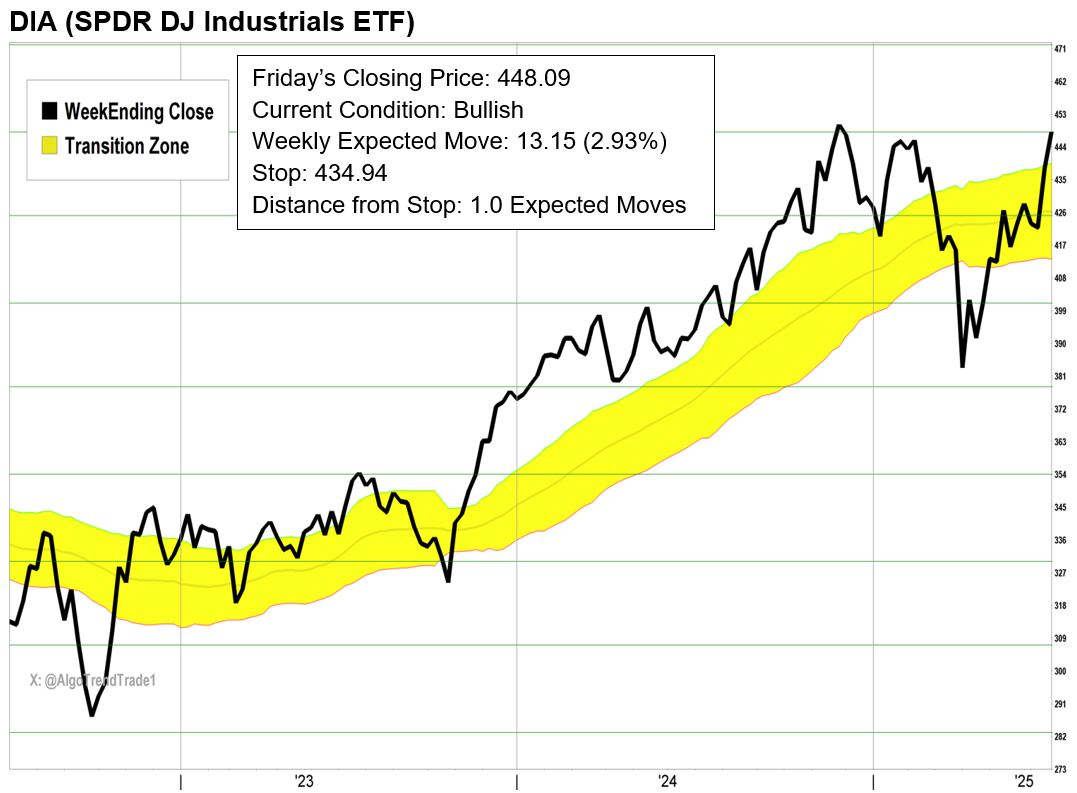
The Technical Signal: Understanding the Transition Zone
The "yellow channel Transition Zone" is a critical component of a specialized trend-following system, acting as a visual indicator of market sentiment. When an asset like DIA crosses this zone, it signals a transition from a neutral or non-trending market to one with a defined direction. For DIA, moving above this zone suggests a bullish trend is forming, providing a clear entry signal for traders.
The importance of this crossover lies in its ability to confirm momentum. In technical analysis, waiting for confirmation through such crossovers can help reduce the likelihood of false signals and improve the probability of trading success.
How the Transition Zone Works
Neutral Zone: Represents a period where no clear trend is present, often characterized by choppy or sideways market movements.
Bullish Zone: Crossing above the transition zone indicates buyers are in control, signaling a potential uptrend.
Bearish Zone: Conversely, crossing below the zone would suggest a bearish trend.
Market Context and Data Analysis
Snapshot Analysis
Today's Change: +0.62%, reflecting positive market sentiment.
Fair Market Value: $447.19, with a current market price suggesting potential undervaluation.
Volume Dynamics: A significant drop in volume (-68.84%) may indicate a consolidation phase before the breakout.
Indicator Analysis
SMA and EMA: The moving averages (SMA: 432.19, EMA: 434.00) support the bullish sentiment as the price moves above these averages.
RSI and MACD: With multiple bullish crossovers and no oversold instances, momentum indicators align with the bullish trend.
Volume and VWAP: A high total volume and a VWAP (Volume Weighted Average Price) of 422.81 suggest strong market interest and support.
Dividend and Holdings
Total Dividends: 10 dividends paid, with consistent payouts indicating a stable income-generating asset.
Top Holdings: Major companies like Goldman Sachs and Microsoft contribute significantly to DIA's performance, enhancing its potential for growth.
Practical Applications for Investors
For investors following systematic approaches, the DIA's move above the transition zone is a clear "go" signal to initiate or increase long positions. This strategy involves:
Entry Point: Entering long positions as soon as the crossover is confirmed, ensuring alignment with the trend.
Stop-Loss Placement: Based on historical volatility (Expected Move or EM), stops are placed to manage downside risk without impeding potential gains.
Position Sizing: Adjusting position size based on risk tolerance and market conditions, often starting with a smaller size if entering the trend late.
Strategic Implications and Forward-Looking Insights
The recent technical developments in DIA present a compelling case for investors to consider increasing their exposure to this ETF. By adhering to disciplined entry and exit criteria, traders and investors can capitalize on this bullish momentum while managing risks effectively.
Market Sentiment and Future Outlook
Positive Indicators: News articles indicate stable economic conditions, with job numbers exceeding expectations and market indices maintaining strength despite geopolitical tensions.
Sector Performance: Bullish trends in key sectors such as technology and financials suggest continued support for DIA's upward trajectory.
As the market navigates these dynamics, the disciplined approach of trend-following provides a robust framework for managing investments. Investors should remain vigilant, monitoring market signals and adjusting their strategies accordingly to maximize returns.
Bottom Line: The DIA's breakout above the yellow channel Transition Zone offers a promising opportunity for momentum traders. By leveraging technical signals and maintaining stringent risk controls, investors can ride this potential uptrend with confidence. Stay informed with DeepStreet.io for ongoing insights and analysis to enhance your investment strategy.